The Complete Candlestick Patterns Guide for Active Traders
Candlestick patterns have guided traders since 18th-century Japan — and they remain one of the most powerful tools in technical analysis today. Each candle reveals the battle between buyers and sellers across stocks, forex, crypto, and commodities. This guide breaks down the essential patterns and how to trade them effectively.
On this page
Understanding Candlestick Patterns: A Practical Trading Guide
Candlestick charts have been around since 18th-century Japan, where a rice trader named Munehisa Homma developed them to track price movements over time. Today they're the backbone of technical analysis across stocks, forex, crypto, and commodities. Each candle encodes four data points: open, high, low, and close. The patterns those candles form reveal the ongoing battle between buyers and sellers, giving you a real edge in anticipating where price is headed next.
Anatomy of a Single Candlestick
Before you can read patterns, you need to read individual candles accurately.
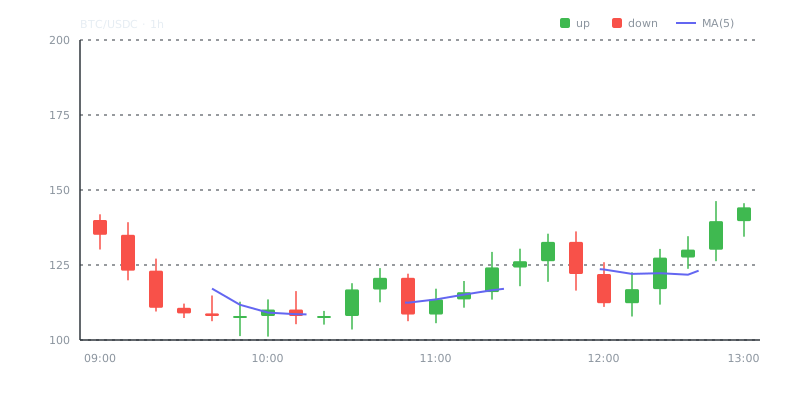
The body of a candlestick represents the range between open and close. A green (or white) body means price closed higher than it opened — bullish. A red (or black) body means price closed lower — bearish. The wicks, sometimes called shadows, extend above and below the body to show the session's high and low.
There are four single-candle signals worth knowing cold.
A Doji has an open and close that are nearly equal, leaving a tiny or nonexistent body. It signals indecision and often shows up right before a reversal when it appears after a strong trend. A Hammer shows a small body near the top with a long lower wick. You'll see it at the bottom of downtrends — buyers rejected lower prices and pushed back up before the close. The Shooting Star is the mirror image: small body near the bottom, long upper wick, appearing at the top of uptrends where sellers took control after buyers briefly pushed price higher. Finally, a Marubozu is a full-bodied candle with no wicks at all. It signals pure conviction, bullish or bearish depending on direction.
Wick length carries as much meaning as body size. A long lower wick tells you bears pushed price down hard, but bulls recovered it before the session closed — real demand stepping in.
Multi-Candle Reversal Patterns
Single candles give you hints. Multi-candle patterns give you confirmation. They're more reliable because they capture a shift in momentum across several sessions, not just one.
Engulfing Patterns
A bullish engulfing pattern forms when a large green candle completely covers the prior red candle's body. Buying pressure has simply overwhelmed selling. The bearish engulfing is the mirror image — a large red candle swallowing the previous green body.
For either pattern to mean anything, it needs to appear after a clear directional move, not in the middle of sideways chop. Volume confirmation makes the signal considerably stronger.
Morning Star and Evening Star
The morning star is a three-candle bullish reversal. First, a large bearish candle extends the downtrend. Then a small-bodied candle — the "star" — gaps lower, showing pure indecision. Finally, a large bullish candle closes well into the first candle's body. The evening star is the bearish equivalent, appearing at the top of an uptrend.
Both patterns are most reliable at key support or resistance levels, and they align naturally with market cycles and sentiment analysis. They tend to appear exactly when sentiment transitions from fear to greed, or the other way around.
Three White Soldiers and Three Black Crows
Three consecutive bullish candles each closing higher than the last — that's three white soldiers. Each candle opens within the prior body and closes near its high. This isn't just a single reaction; it's a sustained shift in momentum.
Three black crows is the inverse: three consecutive bearish candles, each closing lower. Both patterns reflect institutional accumulation or distribution and often mark the start of an entirely new trend phase.
Continuation Patterns
Not every pattern signals a reversal. Some just mean the trend is pausing before it picks back up.
Rising and Falling Three Methods
The rising three methods starts with a strong bullish candle, followed by three small bearish candles that stay within the first candle's range, then another strong bullish candle making a new high. The small pullback is temporary profit-taking. Bulls never actually lost control.
Doji Within a Trend
A doji appearing mid-trend usually signals brief consolidation rather than a reversal, especially when no other reversal signals are present at key levels. Context determines everything here. A doji at resistance calls for caution. A doji mid-channel suggests the trend continues.
Pattern Reliability: A Comparison
Not all patterns carry equal weight. The table below summarizes common patterns by type, reliability, and ideal market context.
| Pattern | Type | Reliability | Best Context |
|---|---|---|---|
| Engulfing (Bullish/Bearish) | Reversal | High | End of trend, at S/R levels |
| Hammer / Shooting Star | Reversal | Moderate | After extended move |
| Morning Star / Evening Star | Reversal | High | Key levels, low volume star |
| Doji | Indecision | Low–Moderate | Depends on location |
| Three White Soldiers / Crows | Reversal | High | After consolidation |
| Rising / Falling Three Methods | Continuation | Moderate | Mid-trend pullback |
| Marubozu | Continuation | Moderate | Breakout confirmation |
| Spinning Top | Indecision | Low | Requires follow-through |
"High reliability" assumes the pattern appears in the right context — at a significant price level with volume supporting the move. Patterns in isolation, without that context, carry almost no edge.
Integrating Patterns into a Trading Strategy
Reading patterns is only half the job. A pattern without a clear trade plan leads to inconsistent results, full stop.
Stop Loss and Take Profit Placement
Every pattern implies a logical invalidation point. For a hammer at support, your stop loss sits below the hammer's low — if price breaks that level, the reversal thesis is wrong. For a bearish engulfing at resistance, the stop goes above the engulfing candle's high.
Stop loss and take profit placement should target a minimum 1:2 risk-to-reward ratio. If your stop is 30 pips away, your target needs to be at least 60 pips. Use the next significant support or resistance level as your take profit anchor rather than a fixed pip count.
Entry: Close of confirmation candle
Stop Loss: Below pattern low (bullish) / Above pattern high (bearish)
Take Profit: Next key resistance (bullish) / Next key support (bearish)
Risk-Reward: Minimum 1:2
Combining Patterns with Indicators
Candlestick patterns get more reliable when you confirm them with other tools. Watch for three things in particular.
Volume first. A reversal candle with above-average volume shows genuine interest, not noise. RSI divergence second — price making new lows while RSI trends upward suggests weakening bearish momentum, which amplifies any bullish pattern you're seeing. Moving averages third. A hammer bouncing off the 200-day EMA carries far more weight than one appearing in the middle of open range.
Never treat a candlestick pattern as a standalone buy or sell signal. It's one input in a multi-factor decision.
Trading Psychology and Pattern Recognition
Here's a trap most traders fall into: once you learn these formations, you start seeing them everywhere. That's confirmation bias, and it quietly erodes your discipline.
Trading psychology and discipline are where most traders actually lose their edge. They enter on a hammer that hasn't closed yet. They skip the stop loss because "the pattern looks clean." They take profit early because a small doji appears — then watch the trend continue without them.
Three practical rules help counter this.
Only trade patterns that have fully closed. A candle that looks like a shooting star mid-session can easily close as a regular bearish candle. Log every pattern trade with the reason, entry, exit, and result, then review that log weekly to identify where your pattern recognition is actually profitable. And reduce your position size when trading in conditions where your historical accuracy is lower — ranging markets, earnings periods, or low-liquidity sessions.
Patterns reflect human psychology at scale: fear, greed, indecision, conviction. Remembering that you're subject to the same psychology as every other market participant keeps you grounded and systematic.
Summary and Key Takeaways
Candlestick patterns are a practical, time-tested way to read market sentiment and anticipate price moves. They work because they reflect real buying and selling behavior, compressed into a visual format that repeats across every timeframe and market.
“The market can remain irrational longer than you can remain solvent.”
— John Maynard Keynes
Three things to take with you. Context is everything — a pattern at a key level after a strong trend is meaningful, while the same pattern in the middle of a range is noise. Confirmation improves accuracy, so volume, indicator confluence, and overall trend direction all increase a pattern's reliability before you pull the trigger. And risk management isn't optional. No pattern is right 100% of the time, which means every trade needs a defined exit before you enter.
Frequently Asked Questions
What is a candlestick pattern and why does it matter in trading?
A candlestick pattern is a visual representation of price movement over a set time period, showing the open, close, high, and low prices as a single 'candle' shape. Traders use these patterns to identify potential reversals or continuations in market trends. They are popular because they give you a quick, visual read on market sentiment without needing complex calculations.
What are the most important candlestick patterns a beginner should learn first?
Start with a few high-probability patterns like the Doji, Hammer, Engulfing, and Morning/Evening Star. These patterns appear frequently across all markets and timeframes, making them practical to recognize early on. Mastering a small set of reliable patterns is more effective than trying to memorize dozens at once.
Can I rely on candlestick patterns alone to make trading decisions?
Candlestick patterns are best used as one tool within a broader strategy, not as a standalone signal. Combining them with indicators like volume, support and resistance levels, or moving averages significantly improves their reliability. No pattern works 100% of the time, so proper risk management is always essential.
Video Resources
Sources & Further Reading
- Investopedia: Technical Analysis — Indicator-by-indicator guides with worked examples.
- TradingView — Charting platform with community education and indicator scripts.
- BabyPips School — Free structured course on chart reading and risk management.
- Investopedia — Reference definitions and explainers for markets and trading.
- CoinGecko — Price history, volume and market capitalisation data.
- Glassnode Academy — On-chain metrics explained, from active addresses to realised cap.
- Wikipedia: Technical analysis — History, methods and the academic debate around technical analysis.