Technical Analysis Fundamentals: A Practical Guide for Active Traders
Technical analysis is the study of historical price data and volume to forecast future market movements. Unlike fundamental analysis, TA focuses on what the market is doing — not why. Learn the core tools and frameworks traders use across stocks, forex, crypto, and commodities.
On this page
Technical analysis (TA) is the study of historical price data and trading volume to forecast where prices might go next. Unlike fundamental analysis, which digs into a company's intrinsic value, TA focuses entirely on what the market is doing — not why. Whether you're trading stocks, forex, crypto, or commodities, understanding TA gives you a repeatable process for spotting entry and exit points, managing risk, and reading market conditions with real confidence.
The Core Premise: Price Discounts Everything
Technical analysis rests on three foundational assumptions.
First, price discounts everything. All available information — fundamentals, sentiment, breaking news — is already baked into the price. Second, price moves in trends. Once a trend gets going, it's more likely to continue than reverse. Third, history repeats. Traders react to similar conditions in similar ways, which is why the same patterns keep showing up on charts decade after decade.
These ideas trace back to Dow Theory, developed by Charles Dow in the late 19th century. Dow identified three market phases: accumulation, public participation, and distribution. Those phases map directly onto modern thinking around market cycles and sentiment analysis, and knowing where you are in a cycle shapes not just what you trade, but how aggressively you size your positions.
Reading Price Charts
Chart Types
Not all charts show you the same thing. Here's how the most common formats compare:
| Chart Type | Data Displayed | Best Use Case |
|---|---|---|
| Line | Closing prices only | Quick trend visualization |
| Bar (OHLC) | Open, High, Low, Close | Detailed session analysis |
| Candlestick | Open, High, Low, Close | Pattern recognition, sentiment |
| Heikin-Ashi | Averaged OHLC | Trend smoothing, noise reduction |
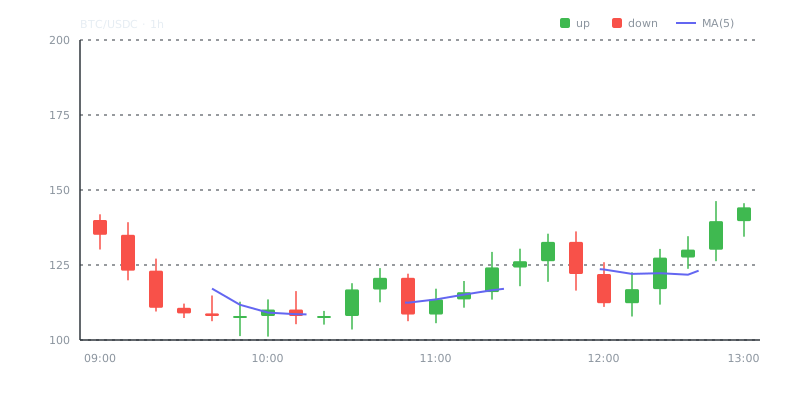
Candlestick charts dominate among active traders because each candle packs in four data points and visually communicates momentum through color and body size. A long green body with small wicks tells you buyers were firmly in control. A small-bodied candle with long wicks on both sides — a doji — tells you the market couldn't make up its mind.
Timeframes
Your chart timeframe should match your trading style. Day traders typically work off 5-minute and 15-minute charts, while swing traders lean on daily and weekly views. A practical approach is multi-timeframe analysis: confirm the trend on a higher timeframe, then drill down to a lower one to time your entry. You're using the bigger picture to set the context and the smaller picture to find precision.
Trend Analysis and Support/Resistance
Identifying Trends
A trend is defined by its swing points. In an uptrend, you'll see a series of higher highs and higher lows. In a downtrend, it's lower highs and lower lows. When highs and lows stay roughly equal, you're in a sideways range.
Trendlines drawn along those swing points create a visual boundary for price. When that structure breaks — say, a higher low suddenly turns into a lower low — it's an early warning that the trend may be losing steam.
Support and Resistance Levels
Support is a price zone where demand has historically outpaced supply, causing price to bounce. Resistance is the opposite. These aren't exact numbers; they're zones. They tend to form around previous swing highs and lows, round numbers like $100 or $50,000, and moving averages that act as dynamic boundaries.
One of the most reliable principles in TA is role reversal: once support breaks, it often flips and becomes resistance. When price comes back to retest that level from below, you get one of the cleaner, higher-probability setups the market offers.
Technical Indicators
Indicators are mathematical calculations built on price or volume data. They generally fall into two camps: trend-following indicators and oscillators.
Trend-Following Indicators
Moving averages smooth out noise and show you direction. The two you'll encounter most are the Simple Moving Average (SMA), which weights all periods equally, and the Exponential Moving Average (EMA), which gives more weight to recent prices and reacts faster.
A crossover strategy — where a shorter EMA crosses above a longer one — is a classic trend entry signal. The most famous example is the "golden cross," where the 50 EMA crosses above the 200 EMA.
# Example: Calculating a simple 20-period SMA in Python
import pandas as pd

prices = pd.Series([...])  # your closing price data
sma_20 = prices.rolling(window=20).mean()
ema_20 = prices.ewm(span=20, adjust=False).mean()
Oscillators
Oscillators measure momentum and work best in ranging markets. RSI (Relative Strength Index) runs from 0 to 100 — readings above 70 suggest overbought conditions, below 30 suggests oversold. MACD tracks the relationship between two EMAs and flags momentum shifts through signal line crossovers. The Stochastic Oscillator compares closing price to a price range over a set period.
Here's something a lot of newer traders learn the hard way: oscillators can stay overbought or oversold for a long time during a strong trend. Shorting a stock just because RSI hit 75 is a quick way to lose money. The indicator is showing strength, not a sell signal.
Indicator Confluence
No single indicator is reliably predictive on its own. The real edge comes from confluence — multiple independent signals pointing to the same conclusion. Price sitting at a known support zone, RSI showing oversold conditions, and MACD crossing bullish at the same moment? That's a far stronger case than any one of those signals alone.
Chart Patterns and Price Action
Chart patterns capture the ongoing battle between buyers and sellers. They split into two categories: continuation and reversal.
Common continuation patterns include flags and pennants (brief consolidations within a trend), ascending and descending triangles, and the cup and handle. On the reversal side, you'll see head and shoulders formations, double tops and double bottoms, and rising or falling wedges.
Each pattern comes with a measured move target — typically the height of the pattern projected from the breakout point. Take a double bottom that spans $10 from trough to neckline, with the neckline sitting at $50. The measured target lands at $60. It's not a guarantee, but it gives you a rational, data-driven level to work toward.
Price action trading takes this further by stripping away indicators entirely, focusing on raw patterns, candlestick signals, and structural levels. A lot of professional traders prefer this approach because it relies on direct market behavior rather than lagging derivatives of price.
Integrating Risk Management and Position Sizing
Technical analysis tells you where to trade. Risk management principles tell you how much to risk. Without both working together, even a high-accuracy setup can produce net losses over time.
The framework is straightforward. Before entering, define your invalidation point — your stop loss — and place it at a technically meaningful level, like below a support zone, not just an arbitrary 5% below your entry. Then risk a fixed percentage of your total account per trade, typically somewhere between 1% and 2%. Your position size flows from the distance to your stop and the dollar amount you're willing to lose.
# Position sizing formula
account_balance = 10000       # USD
risk_per_trade = 0.01         # 1%
entry_price = 150.00
stop_loss_price = 145.00

risk_per_share = entry_price - stop_loss_price   # $5.00
risk_amount = account_balance * risk_per_trade   # $100
position_size = risk_amount / risk_per_share     # 20 shares
This applies whether you're a swing trader making five trades a month or a day trader making fifty. It also connects to longer-term capital deployment. Traders building a position over time might pair TA entry signals with a dollar cost averaging vs lump sum approach, using technical levels to time entries more precisely rather than buying at fixed intervals regardless of where price is.
Summary and Key Takeaways
Technical analysis is a structured way to read market behavior through price and volume. It doesn't predict the future with certainty — nothing does — but it gives you a repeatable process for identifying high-probability setups, defining your risk, and executing consistently.
A few things worth keeping close:
“The market can remain irrational longer than you can remain solvent.”
— John Maynard Keynes
Price charts reflect collective market psychology. Learning to read them shows you the balance between buyers and sellers at any given moment. Trend identification is the foundation — trade with the dominant trend on your primary timeframe and use lower timeframes for entry precision. Indicators confirm; they don't lead. Use them to add confluence to a setup you've already identified through price structure. Chart patterns give you measurable targets, so use the measured move technique to set realistic profit expectations. And risk management isn't separate from TA — it's part of it. A technically sound entry with poor position sizing is still a poorly managed trade.
Frequently Asked Questions
What is technical analysis and how is it different from fundamental analysis?
Technical analysis studies price charts and trading volume to predict future price movements based on historical patterns. Fundamental analysis, by contrast, looks at a company's financial health, earnings, and economic factors. Technical analysts believe that all known information is already reflected in the price, so reading the chart is enough.
What are support and resistance levels and why do traders care about them?
Support is a price level where buying interest tends to stop a downtrend, while resistance is a level where selling pressure tends to halt a rally. Traders use these levels to plan entries, exits, and stop-losses because price often reacts predictably at them. When a support or resistance level breaks, it frequently signals a significant move in that direction.
What are the most common technical indicators beginners should learn first?
The most beginner-friendly indicators are moving averages, the Relative Strength Index (RSI), and MACD. Moving averages smooth out price data to show the overall trend, RSI measures whether an asset is overbought or oversold, and MACD helps identify momentum shifts and potential trend reversals. Starting with just these three gives you a solid foundation without overwhelming you with too many signals.
Video Resources
Sources & Further Reading
- Investopedia: Technical Analysis — Indicator-by-indicator guides with worked examples.
- TradingView — Charting platform with community education and indicator scripts.
- BabyPips School — Free structured course on chart reading and risk management.
- Investopedia — Reference definitions and explainers for markets and trading.
- CoinGecko — Price history, volume and market capitalisation data.
- Glassnode Academy — On-chain metrics explained, from active addresses to realised cap.
- Wikipedia: Technical analysis — History, methods and the academic debate around technical analysis.