Moving Averages Explained: A Practical Trading Guide
Moving averages are one of the most essential tools in technical analysis, helping traders smooth out price noise and spot trends across stocks, forex, and crypto. This guide breaks down how they work, the key types, and how to apply them in your strategy.
On this page
Moving averages are some of the most widely used tools in technical analysis, and for good reason. They smooth out price data over a defined period, helping you spot trends, reversals, and potential entry or exit points. Whether you're trading stocks, forex, or crypto, knowing how moving averages work — and when to reach for each type — is foundational to building a strategy you can actually trust.
“The trend is your friend until the end when it bends.”
— Ed Seykota
What Is a Moving Average?
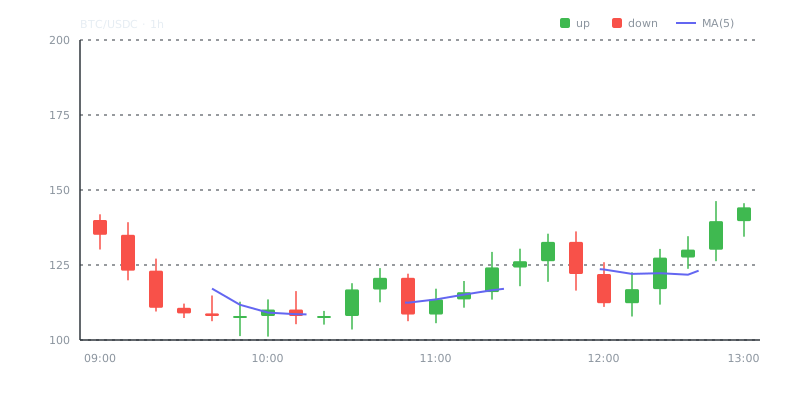
A moving average calculates the average price of an asset over a specific number of periods. As new price data comes in, the oldest data point drops off and the average "moves" forward. This rolling calculation filters out short-term noise and reveals where price is actually heading underneath all that volatility.
The "period" just means how many candles or time units go into the calculation. A 20-period MA on a daily chart averages the closing prices of the last 20 trading days. Put that same MA on a 1-hour chart and it's averaging the last 20 hours instead.
Types of Moving Averages
Simple Moving Average (SMA)
The SMA adds up closing prices over a set period and divides by the number of periods. Every data point carries equal weight — nothing fancy.
Formula:
SMA = (P1 + P2 + ... + Pn) / n

Example (5-period SMA):
Prices: 100, 102, 101, 105, 103
SMA = (100 + 102 + 101 + 105 + 103) / 5 = 102.2
Because it weights every period equally, the SMA reacts slowly to recent price changes. That's actually useful for identifying longer-term trends, but during fast-moving markets it can lag so badly that the signal arrives after the move is mostly over.
Exponential Moving Average (EMA)
The EMA applies a multiplier that gives more weight to recent prices. That makes it more responsive to what the market is doing right now.
Formula:
Multiplier = 2 / (n + 1)
EMA = (Current Price × Multiplier) + (Previous EMA × (1 - Multiplier))

Example (10-period EMA multiplier):
Multiplier = 2 / (10 + 1) = 0.1818
Short-term traders and anyone working with volatile assets tend to prefer the EMA for exactly that speed. The tradeoff is real though — react too fast and you'll catch more false signals, especially in choppy conditions.
Weighted Moving Average (WMA)
The WMA assigns linearly increasing weights to more recent prices. The most recent period gets the highest weight, the second most recent gets the second-highest, and so on down the line.
WMA = (P1×1 + P2×2 + ... + Pn×n) / (1 + 2 + ... + n)Think of it as sitting between the SMA and EMA in terms of responsiveness. It's more reactive than the SMA but slightly less aggressive than the EMA — a middle ground that some traders prefer when neither extreme feels right.
Comparing Moving Average Types
| Feature | SMA | EMA | WMA |
|---|---|---|---|
| Reaction to price changes | Slow | Fast | Moderate |
| Lag | High | Low | Medium |
| Best for | Long-term trends | Short-term trading | Balanced analysis |
| Sensitivity to outliers | High (equal weight) | Low | Medium |
| Common periods | 50, 100, 200 | 9, 12, 26 | 10, 20 |
| Complexity | Low | Medium | Medium |
How Traders Use Moving Averages
Trend Identification
The simplest use is just figuring out which direction the trend is running. Price consistently above the MA means bullish. Below it means bearish. A flattening MA tells you the market is probably ranging.
A common approach combines a short-period MA with a long-period MA. When the shorter one crosses above the longer one, that signals a potential uptrend — you've probably heard this called a golden cross. The opposite, where the shorter MA crosses below, is a death cross and points toward a potential downtrend.
Take Bitcoin as a concrete example: a trader watching the 50-day EMA cross above the 200-day EMA on the daily chart might read that as confirmation of a medium-term bullish trend and start looking for long entries.
Support and Resistance Levels
Moving averages frequently act as dynamic support and resistance — unlike static horizontal levels, these shift with price over time. In an uptrend, price often pulls back to the MA and bounces. In a downtrend, price rallies to the MA and rolls over.
The 50-period and 200-period MAs carry extra weight because so many institutional traders and algorithmic systems reference them. A clean close above a major MA can confirm a shift in market structure. A rejection from one reinforces the prevailing trend.
Entry and Exit Signals
Traders use MA crossovers, bounces, and breaks as entry or exit triggers. A disciplined setup might look like this:
- Entry: Price pulls back to the 20-period EMA in an uptrend, then forms a bullish candlestick pattern at that level
- Stop-loss: Placed below the MA
- Target: Previous swing high or a fixed risk-reward ratio
This kind of setup pairs moving averages with price action, so you're not relying on a single signal to make the decision.
Moving Averages in Strategy Contexts
Grid Trading Strategy
In a grid trading strategy, moving averages help define the boundaries and center of the grid. You might set the central price level at the current 50-period SMA, then place buy and sell orders at equal intervals above and below it. When price oscillates within a range — which moving averages help you confirm — the grid captures profit on both sides. If the MA starts trending hard in one direction, that's usually a sign to pause or adjust the grid before you build up too much exposure on one side.
Leverage Trading
When you're trading with leverage, moving averages take on real importance for risk management. The risks and rewards are amplified — a small adverse move can wipe out a position faster than you'd expect. Using the 20- or 50-period EMA as a dynamic stop reference helps you avoid holding losing positions too long.
A practical rule: a leveraged long position uses a close below the 20-period EMA as a hard exit, regardless of how confident you feel about the underlying thesis. That keeps drawdowns manageable when volatility picks up.
Common Mistakes and How to Avoid Them
Using a single MA in isolation. A moving average alone doesn't tell you about trend strength, volume, or momentum. Pair it with tools like RSI, MACD (which is itself built from EMAs), or volume indicators.
Optimizing for past performance. Backtesting a 17-period EMA because it performed well historically doesn't mean it'll keep working. Stick to widely-used periods like 9, 20, 50, and 200 — those are the levels the broader market is already watching.
Ignoring timeframe context. A death cross on a 15-minute chart is nowhere near as meaningful as one on the daily or weekly. Always interpret MA signals against higher timeframe trends.
Treating MAs as precise lines. Moving averages are zones, not exact levels. Price will often wick through an MA before reversing. If you treat every touch as a guaranteed bounce, you'll enter too early and get stopped out too often.
Summary and Key Takeaways
Moving averages are versatile, practical tools that work across asset classes and timeframes. They won't predict the future, but they give you a structured way to read price behavior, define trend direction, and manage risk.
Worth keeping in mind:
- The SMA works best for long-term trend analysis; the EMA suits active short-term trading because it responds faster to recent price action.
- Moving averages act as dynamic support and resistance, especially at widely-watched periods like the 50 and 200.
- Crossover strategies like the golden cross and death cross give you clear, rule-based signals, but always confirm them with additional indicators.
- In grid trading, MAs help you set rational grid centers and boundaries that match current market structure.
- In leveraged trading, MAs serve as disciplined exit triggers that cap your downside when markets move fast.
- Don't over-optimize your MA periods. The most useful levels are the ones every market participant is already watching.
Start with the 20, 50, and 200-period MAs on daily charts. Watch how price interacts with them over weeks, not days. That direct observation builds the kind of intuition no backtester can fully replicate.
Frequently Asked Questions
What is a moving average and why do traders use it?
A moving average is a line on a chart that shows the average price of an asset over a set number of days, smoothing out short-term price noise. Traders use it to spot the overall trend direction — if price is above the moving average, the trend is generally up, and below it suggests a downtrend.
What is the difference between a simple moving average (SMA) and an exponential moving average (EMA)?
A simple moving average gives equal weight to every price in the lookback period, while an exponential moving average gives more weight to recent prices, making it react faster to new price action. Beginners often start with the SMA for its simplicity, but the EMA is popular for shorter-term trading because it catches trend changes sooner.
How do I know which moving average period to use, like 50-day vs 200-day?
Shorter periods like the 20 or 50-day moving average react quickly to price changes and are better for short-term trading, while longer periods like the 200-day are used to identify the big-picture trend. A common beginner strategy is to watch both — when a shorter MA crosses above a longer one, it can signal a potential uptrend, known as a golden cross.
Video Resources
Sources & Further Reading
- Investopedia: Technical Analysis — Indicator-by-indicator guides with worked examples.
- TradingView — Charting platform with community education and indicator scripts.
- BabyPips School — Free structured course on chart reading and risk management.
- Investopedia — Reference definitions and explainers for markets and trading.
- CoinGecko — Price history, volume and market capitalisation data.
- Glassnode Academy — On-chain metrics explained, from active addresses to realised cap.
- Wikipedia: Technical analysis — History, methods and the academic debate around technical analysis.