On-Chain Analysis Basics: Reading Blockchain Data for Better Trading
On-chain analysis examines blockchain transaction data to understand real market behavior beyond price charts. Learn how tracking wallet movements, holder patterns, and network activity reveals what traders are actually doing with their assets—giving you an edge in crypto markets.
On this page
Blockchain networks record every transaction, balance change, and smart contract interaction in a public, immutable ledger. On-chain analysis digs into this data to understand market behavior, spot trends, and make better trading decisions. Unlike traditional technical analysis, which only looks at price and volume, on-chain analysis shows you what participants are actually doing with their assets — whether they're accumulating, distributing, or just sitting on their hands.
That transparency creates opportunities you simply don't get in traditional markets. You can watch when large holders move funds, track exchange inflows that might signal selling pressure, or spot accumulation patterns that suggest real confidence. The hard part is interpreting all that data correctly and separating signal from noise.
What On-Chain Data Reveals
On-chain metrics fall into several categories, each giving you a different window into market conditions.
Transaction Volume and Activity
Raw transaction counts show network usage, but context matters a lot. A spike in transactions might mean genuine adoption, or it might just be an NFT mint generating thousands of tiny transfers. Transaction volume — the total value moved — gives you a clearer picture of real economic activity. When Bitcoin's transaction volume climbs while price stays flat, that usually points to growing real-world use rather than pure speculation.
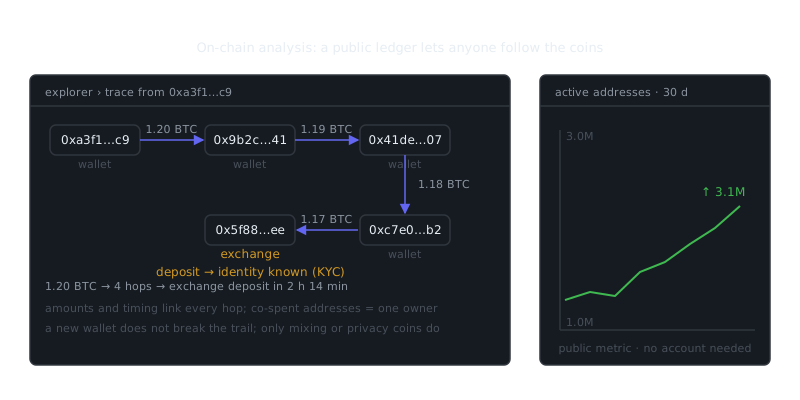
Active addresses measure unique participants. A rising active address count alongside price growth confirms genuine interest. When active addresses drop while price keeps climbing, though, that rally probably lacks broad participation and could turn out to be fragile.
Exchange Flows
Tracking how crypto moves to and from exchanges tells you a lot about intent. Large inflows to exchanges typically come before selling — people deposit assets when they want to trade them. Sustained exchange inflows often line up with price declines as that supply hits the market.
Exchange outflows tell the opposite story. When users pull assets into personal wallets, they're signaling they plan to hold, not trade. During the 2020-2021 Bitcoin bull run, consistent exchange outflows showed institutional buyers moving coins into cold storage rather than keeping them available to sell.
The exchange netflow metric — inflows minus outflows — gives you a quick sentiment read. Negative netflow means more withdrawals than deposits, which is a bullish sign. Positive netflow is a warning that selling pressure may be building.
Supply Distribution
Looking at how supply concentrates or spreads across addresses reveals a lot about holder behavior. When large wallets accumulate a growing share of supply, it can mean institutional buying or concerning centralization, depending on the broader context.
The percentage of supply held by long-term holders (addresses that haven't moved in six months or more) reflects conviction. When that number rises during price corrections, experienced holders aren't panicking. When long-term holders start moving coins during a rally, it often signals profit-taking near a cycle top.
Key On-Chain Metrics for Traders
Realized Cap and MVRV Ratio
Market cap multiplies current price by circulating supply, treating every coin the same regardless of when it was bought. Realized cap takes a different approach — it weights each coin by the price it last moved on-chain, which approximates the aggregate cost basis across all holders.
The MVRV ratio divides market cap by realized cap. Above 3.5, Bitcoin has historically been near a market top, as holders sitting on large unrealized profits start taking gains. Below 1, market cap sits under realized cap, meaning most holders are underwater. That zone has consistently marked Bitcoin bottoms.
# Conceptual calculation
market_cap = current_price * circulating_supply
realized_cap = sum(coin_value_at_last_move for each coin)
mvrv_ratio = market_cap / realized_cap

# Interpretation zones
# MVRV > 3.5: Potential top, high profit-taking risk
# MVRV 1-3: Normal range
# MVRV < 1: Potential bottom, capitulation zone
Network Value to Transactions (NVT) Ratio
NVT divides network value (market cap) by daily transaction volume. Think of it as a blockchain equivalent to the price-to-earnings ratio. A high NVT suggests the network is overvalued relative to its actual usage — price has outpaced real activity. A low NVT suggests the network may be undervalued given what it's actually processing.
During Bitcoin's 2017 bubble, NVT ratios shot past 150 as speculation drove prices far beyond transaction growth. After the crash, NVT settled back below 50, a much healthier level.
“The market can remain irrational longer than you can remain solvent.”
— John Maynard Keynes
Stock-to-Flow and Production Metrics
Bitcoin's stock-to-flow ratio compares existing supply to annual production. Each halving cuts block rewards in half, which doubles the stock-to-flow ratio and reduces the pace of new supply entering circulation.
Miner behavior also sends useful signals. When miners hold newly generated coins instead of selling immediately, it suggests they expect prices to go higher. Aggressive miner selling, on the other hand, can pressure prices — especially after sharp rallies when miners lock in profits.
Practical Application Framework
On-chain analysis works best when it's part of a broader approach, not used in isolation. A multi-layered framework looks something like this:
| Analysis Layer | What It Shows | Best Used For |
|---|---|---|
| Price Action | Market sentiment, trends | Entry and exit timing |
| On-Chain Metrics | Holder behavior, supply dynamics | Regime identification, macro positioning |
| Technical Indicators | Momentum, overbought/oversold | Timing refinement within regime |
| Fundamentals | Network development, adoption | Long-term conviction |
Start with on-chain data to identify the market regime. Is MVRV pointing toward euphoria or capitulation? Are exchange flows bullish or bearish? That gives you your macro framework.
From there, use traditional technical analysis to sharpen your timing. On-chain data might tell you accumulation is happening and the structure looks bullish, but moving averages help you time specific entries. The 50-day and 200-day moving averages are still useful for reading trend direction even when on-chain data is driving your conviction.
It's worth backtesting how on-chain signals would have played out in past cycles. Look at how metrics behaved at previous market extremes. The 2018 Bitcoin bottom, for example, coincided with MVRV dropping below 1, exchange outflows accelerating, and long-term holder supply rising. Recognizing those patterns puts you in a better position to act when they show up again.
Common Pitfalls and Limitations
On-chain analysis has real limitations, and understanding them keeps you from drawing bad conclusions.
Exchange Aggregation
Major exchanges hold customer funds in pooled wallets. A single large transaction might just be internal accounting rather than actual user deposits or withdrawals. To get accurate exchange flow data, use services that identify and exclude known internal transfers.
Chain-Specific Differences
Metrics built for Bitcoin don't automatically translate to Ethereum or other chains. Ethereum's smart contract activity inflates transaction counts compared to simple value transfers. DeFi protocols generate constant token movements that don't carry the same economic meaning as a standard Bitcoin transaction.
Lagging Indicators
Many on-chain metrics lag price. Realized cap only updates when coins move, so it trails market cap during fast-moving periods. Pair leading indicators like exchange flows with lagging ones like realized cap to get a more balanced read.
Privacy Technologies
Mixing services, privacy coins, and layer-two solutions obscure on-chain activity. Lightning Network transactions don't show up on Bitcoin's base layer at all. As privacy-preserving technologies see wider adoption, that on-chain transparency will continue to shrink.
Tools and Resources
Sev
Frequently Asked Questions
What is on-chain analysis and how is it different from technical analysis?
On-chain analysis looks at data recorded directly on the blockchain, like wallet activity, transaction volume, and how long people have held their coins. Technical analysis, by contrast, only looks at price and volume charts. On-chain data gives you insight into what real holders are actually doing, not just what the price is doing.
What are some basic on-chain metrics beginners should start with?
Good starting points are Active Addresses (how many wallets are transacting daily), Exchange Inflows and Outflows (whether people are moving coins onto exchanges to sell or off exchanges to hold), and HODL Waves (how long current holders have owned their coins). These three metrics together give you a solid picture of market sentiment and potential selling pressure.
Where can I find on-chain data for free?
Glassnode, CryptoQuant, and IntoTheBlock all offer free tiers with access to core on-chain metrics for major cryptocurrencies like Bitcoin and Ethereum. For on-chain data directly from the blockchain without a middleman, tools like Dune Analytics let you query raw data yourself, though that requires some SQL knowledge.
Video Resources
Sources & Further Reading
- Glassnode Academy — On-chain metrics explained, from active addresses to realised cap.
- Investopedia — Reference definitions and explainers for markets and trading.
- Investopedia: Technical Analysis — Indicator-by-indicator guides with worked examples.
- TradingView — Charting platform with community education and indicator scripts.
- CoinGecko — Price history, volume and market capitalisation data.
- BabyPips School — Free structured course on chart reading and risk management.
- Wikipedia: Technical analysis — History, methods and the academic debate around technical analysis.