Trading Journal Best Practices That Actually Improve Your Edge
A trading journal transforms intuition into data and converts losing streaks into learning opportunities. Most traders abandon journaling within weeks because they track the wrong metrics or create systems too complex to maintain.
On this page
A trading journal turns intuition into data and losing streaks into learning opportunities. Most traders abandon journaling within weeks, though — not because they lack discipline, but because they track the wrong things or build systems too complicated to maintain. The difference between a journal that sharpens your edge and one that collects dust comes down to one thing: capturing actionable information consistently.
This guide covers how to build a journal that reveals your true performance patterns, identifies which setups actually work for you, and exposes the psychological blind spots quietly eating your returns.
Essential Components of an Effective Trading Journal
Every trade entry needs six things: entry price and time, exit price and time, position size, the setup name, the reason you entered, and the outcome. Skip any of these and you're collecting anecdotes, not data.
The setup name matters more than most traders think. Label your trades — "breakout," "pullback to support," "earnings momentum" — and you can filter results by strategy. After 50 trades, you'll know which setups produce positive expectancy and which ones drain your account regardless of what the market is doing.
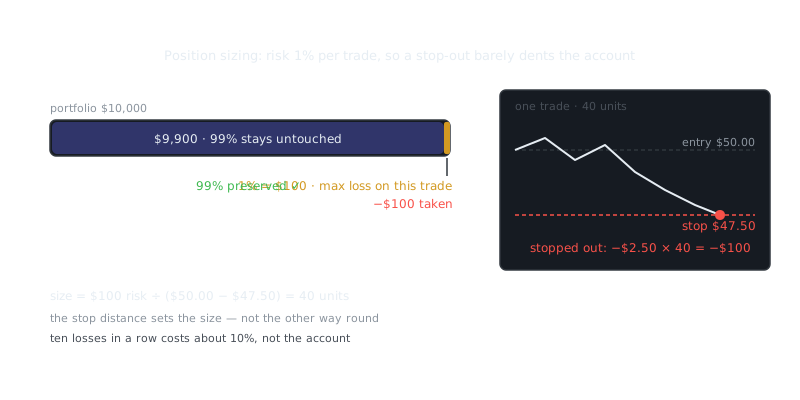
Position sizing belongs in every entry because it determines whether a 3% move is a disaster or a minor setback. Recording your share count alongside your account size at the time shows whether you're sizing consistently or letting emotions amplify risk during drawdowns.
The entry reason is what separates disciplined execution from impulse trading. Write the specific trigger: "20-day moving average bounce with RSI above 50" beats "looked oversold" every time. After 100 trades, you'll see whether your winners shared common entry conditions or whether your profits were essentially random.
Tracking Psychology and Execution Quality
Performance metrics tell you what happened. Psychological notes explain why — and predict what happens next.
Before each trade, rate your emotional state on a simple three-point scale: calm and confident, slightly anxious, or emotional and reactive. After three months, overlay those ratings on your P&L. The correlation between emotional trading and negative returns tends to shock traders who think of themselves as disciplined.
Execution quality deserves its own field. Did you follow your plan exactly, partially, or not at all? Flag trades where you moved your stop loss, added to a losing position, or exited early without a technical reason. These are the moments where discipline breaks down under pressure, and you can't fix what you don't track.
Sleep and stress matter more than most traders admit. A simple "well-rested" or "poor sleep" tag takes five seconds to add and often explains clusters of bad decisions. Some traders discover their worst trades happen after sleeping fewer than six hours or during high-stress periods at work.
Don't forget near-misses — setups you almost took but passed on. Recording those with your reasoning ("waited for confirmation that never came" or "hesitated after a rough week") shows whether your caution is protecting you or costing you your best opportunities.
Organizing Data for Analysis
Structure determines whether your journal produces real insights or just becomes a digital shoebox. Use consistent categories and tags from day one, and don't change them halfway through.
Market Condition Tags
Every trade happens in a specific environment: trending, range-bound, high volatility, or low volatility. Tag each entry. Six months in, you might discover you're a trend trader bleeding money in choppy markets, or a mean-reversion trader who falls apart in strong directional moves. That's genuinely valuable self-knowledge.
Time-Based Patterns
Record the time of day for entries and exits. Many traders find they're solidly profitable in the first 90 minutes after the open but give it all back in the afternoon grind. Others take their worst trades in the final hour, chasing moves instead of waiting for clean setups. You won't know which camp you're in until you look at the data.
Comparing Strategy Performance
After you've collected enough trades, put your strategies side by side:
“Risk comes from not knowing what you're doing.”
— Warren Buffett
| Strategy Type | Win Rate | Avg Win | Avg Loss | Profit Factor | Sample Size |
|---|---|---|---|---|---|
| Breakout | 42% | $340 | $180 | 1.65 | 68 |
| Pullback | 58% | $220 | $210 | 1.45 | 112 |
| Earnings | 38% | $580 | $260 | 1.38 | 29 |
| Range Fade | 52% | $180 | $195 | 1.02 | 94 |
A 42% win rate with a 1.65 profit factor outperforms a 58% win rate with a 1.02 profit factor — but most traders chase win rate because it feels better. Your journal won't let you lie to yourself about this.
Connecting Journal Data to Technical Analysis
Generic advice says "buy pullbacks to the 50-day moving average." Your journal tells you whether you actually profit from that setup. That's a meaningful difference.
Track which technical indicators were present before your winning trades. If you use RSI, MACD, and moving averages, note which signals appeared at entry. After 100 trades, count how often each indicator showed up in profitable versus unprofitable setups. Most traders find they're running three indicators when only one consistently correlates with good outcomes.
Chart patterns need the same scrutiny. Did you enter that "bull flag" based on a textbook setup, or a loose interpretation that you talked yourself into? Compare the results over time. Strict adherence to pattern rules usually beats creative interpretations that force setups where there aren't any.
Support and resistance accuracy also varies by market and timeframe. Track whether your entry near support held or failed. If support holds 70% of the time on daily charts but only 45% on 15-minute charts, your journal is telling you exactly where to focus.
Integrating Journaling with Backtesting
Backtesting shows you theoretical edge. Your journal shows you actual edge — under live conditions, with real execution, slippage, and emotions in the mix.
Compare your backtested results against live journal results for the same strategy. A mean-reversion system might show a 2.1 profit factor in backtests but only 1.3 in live trading. That gap usually points to specific execution problems: entering late, exiting early, or skipping the best setups out of fear.
Here's a simple way to track the comparison:
Strategy: Pullback to 20 EMA
Backtest Results (2020-2023):
  - Win Rate: 61%
  - Profit Factor: 1.87
  - Avg Trade: $245

Live Results (Past 6 Months):
  - Win Rate: 54%
  - Profit Factor: 1.42
  - Avg Trade: $178

Execution Gaps:
  - Entering 2-3 bars later than backtest signal
  - Exiting before profit target 35% of the time
  - Skipping 18 valid setups during drawdown period
When you see it laid out like this, the problem gets specific. The strategy works — your implementation needs work.
Digital Tools and Maintenance Systems
Spreadsheets handle most journaling needs. Google Sheets or Excel with structured columns, dropdown menus for categories, and pivot tables for analysis cost nothing and have almost no learning curve.
Dedicated software like Edgewonk or TraderSync automates chart capture and P&L import, but it adds cost and platform dependency. Start with a spreadsheet until you're sure you'll actually stick with the habit.
A functional spreadsheet setup looks like this:
Columns:
Date | Time | Symbol | Direction | Entry Price | Exit Price |
Shares | P&L | Setup Type | Market Condition | Emotional State |
Followed Plan (Y/N) | Technical Trigger | Notes

Dropdown Values:
Setup Type: Breakout, Pullback, Reversal, Momentum, Range
Market Condition: Trending, Choppy, High Vol, Low Vol
Emotional State: Calm, Anxious, Reactive
Review your journal weekly, not just at the end of each trade. Patterns emerge over time, and a weekly review keeps you honest about whether your habits are improving or drifting.
Frequently Asked Questions
What should I write in my trading journal after every trade?
Record the date, asset, entry and exit price, position size, and your reasoning for taking the trade. Also note your emotional state and whether you followed your trading plan. This gives you enough data to spot patterns in both your strategy and your behavior over time.
How often should I review my trading journal?
Review individual trades daily, but do a deeper analysis weekly or monthly to look for recurring mistakes or winning patterns. Consistent review is what turns raw notes into actual lessons — without it, the journal loses most of its value.
Do I need special software for a trading journal or will a spreadsheet work?
A simple spreadsheet works perfectly well when you're starting out, especially since it's easy to customize for the metrics you care about. Dedicated tools like Tradervue or Edgewonk add automation and better analytics, but they're worth considering only once you know what data matters most to your process.
Video Resources
Sources & Further Reading
- Investopedia — Reference definitions and explainers for markets and trading.
- Investopedia: Technical Analysis — Indicator-by-indicator guides with worked examples.
- TradingView — Charting platform with community education and indicator scripts.
- CoinGecko — Price history, volume and market capitalisation data.
- BabyPips School — Free structured course on chart reading and risk management.
- Glassnode Academy — On-chain metrics explained, from active addresses to realised cap.
- Wikipedia: Technical analysis — History, methods and the academic debate around technical analysis.