How to Survive and Thrive in Crypto Bear Markets
Bear markets test every trader's discipline and resilience. This guide covers proven strategies for surviving severe downturns, from risk management to position sizing, helping you adapt when sentiment shifts from greed to fear.
On this page
Bear markets test every trader's discipline, strategy, and emotional resilience. Defined as a decline of 20% or more from recent highs, crypto bear markets can be far more brutal than anything you'd see in traditional finance — drawdowns of 80-90% aren't rare, they're normal. What separates traders who make it through from those who blow up their accounts comes down to three things: preparation, risk management, and the ability to adapt when the mood shifts from greed to fear.
“Cut your losses short and let your profits run.”
— Jesse Livermore
This guide covers proven strategies for preserving capital, spotting opportunities, and positioning yourself to capitalize when the market eventually turns around.
Understanding Bear Market Psychology
Bear markets move through distinct phases, and each one demands a different approach. In the initial denial phase, traders keep buying dips out of habit, convinced a quick recovery is coming. Then comes capitulation — panic selling, maximum fear, and portfolios getting cut in half. Finally, the accumulation phase brings sideways, boring price action while smart money quietly builds positions.
Your goals shift fundamentally during a bear market. Preserving capital matters more than growing it. Think about it this way: a 50% loss requires a 100% gain just to break even. Traders who protect 70-80% of their capital during a downturn walk into the recovery with significantly more buying power than those who held on and hoped.
Market structure changes too. Support levels that held for months break decisively. Resistance forms at previous support zones. Dead cat bounces trap optimistic traders, while genuine bottoms tend to form when sentiment hits maximum pessimism and trading volume nearly disappears.
Position Sizing and Risk Management
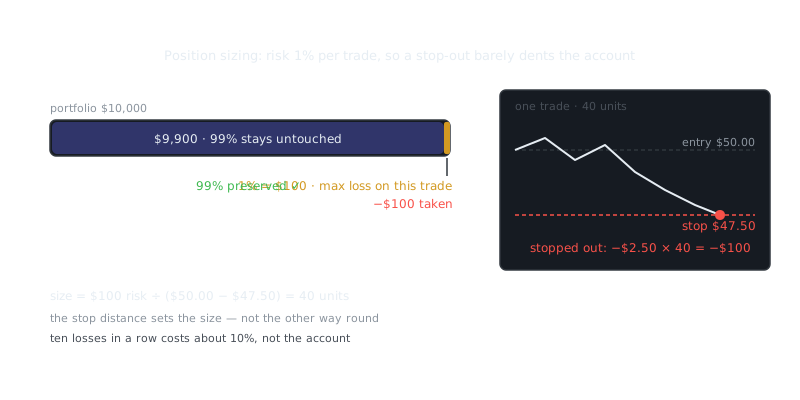
Cut your position sizes to 25-50% of what you'd use in a bull market. Smaller positions let you ride out volatility without forced liquidations and keep capital available for better opportunities. The traders who survive bear markets aren't the ones catching falling knives — they're the ones who stay in the game.
Put hard stop losses on every position, no exceptions. In bear markets, hoping for a recovery instead of cutting a loss leads to the kind of drawdowns that end trading careers. A disciplined 8-10% stop loss hurts, but it protects you even when choppy conditions trigger several small losses in a row. Bear market rallies fail far more often than bull market dips do.
Here's a simple position sizing framework worth keeping handy:
| Market Condition | Position Size | Stop Loss | Max Portfolio Risk |
|---|---|---|---|
| Strong Bull | 5-10% per trade | 15-20% | 3-5% per trade |
| Bear Market | 2-5% per trade | 8-10% | 1-2% per trade |
| Capitulation | 1-3% per trade | 6-8% | 0.5-1% per trade |
Cash is a position. Holding 50-70% in stablecoins or fiat isn't missing out — it's dry powder waiting for the right moment. Missing a 10% bounce hurts a lot less than watching an overleveraged position collapse.
Short-Term Trading Strategies
Range trading works better than trend following in bear markets. Price tends to bounce repeatedly between defined support and resistance levels, and you can trade those bounces with tight stops below support. Look for previous consolidation areas and horizontal volume profiles to map these zones.
Short-biased setups also offer real directional opportunities. Watch for failed rally attempts at resistance, especially when paired with bearish candlestick patterns like evening stars or bearish engulfing candles. Lower highs and lower lows define the downtrend — trading with that momentum rather than against it keeps the odds in your favor.
Scalping and day trading gain an edge over swing trading for one practical reason: overnight risk. Bad news tends to drop outside trading hours, and waking up to a gap-down is a miserable way to start the day. Intraday moves still offer 2-5% opportunities without that exposure.
Here's what a range trade setup looks like in practice:
Entry: BTC at $28,000 (range support, previous consolidation)
Stop Loss: $27,200 (below support zone)
Take Profit 1: $29,500 (mid-range)
Take Profit 2: $31,000 (range resistance)
Position Size: 3% of portfolio
Risk: 2.8% loss if stopped out
Accept smaller gains. A 3-5% profit in a bear market is worth as much as 10-15% in a bull market once you account for reduced opportunity and higher risk.
Hedging and Derivatives
The choice between spot and futures trading becomes critical in a bear market. Spot limits your losses to what you put in. Futures give you hedging tools but come with liquidation risk that can wipe you out fast. Unless you're experienced with derivatives, spot should be your home base.
For traders who do use futures, hedging spot positions with short contracts acts as insurance. Hold 10 ETH spot? A 5 ETH short at 0.5x leverage protects against further downside while keeping your long-term position intact. You'll pay funding fees, but that beats selling at the bottom.
Put options, where available, offer defined-risk downside protection. Buying puts on your largest holdings caps your maximum loss while keeping upside open if markets recover unexpectedly. The premium you pay works like any other insurance policy — you hope you don't need it.
Perpetual funding rates are worth monitoring as a sentiment indicator. When funding goes deeply negative (shorts paying longs) during an extended decline, over-leveraged shorts often get squeezed, which can spark short-term bounces. Use it as a contrary signal, not a precise timing tool.
# Example: Check BTC funding rate (using exchange API)
curl -X GET "https://api.exchange.com/v1/funding-rate?symbol=BTCUSDT"

# Typical outputs:
# -0.01% to -0.05%: Moderate bearish sentiment
# -0.1% or lower: Extreme short interest, potential squeeze
# Positive rates in bear market: Rare, possible local bottom
Dollar-Cost Averaging and Accumulation
Systematic buying during bear markets builds positions at better average prices. Rather than trying to nail the exact bottom — which almost nobody does — dollar-cost averaging spreads your entries across the decline. It removes emotional decision-making and guarantees you'll participate in the eventual recovery.
Structure your DCA with increasing conviction as prices fall. Early in a bear market, smaller allocations make sense because more downside likely remains. As price approaches previous cycle lows or historically strong support levels, increase your allocation sizes. This tiered approach is more effective than buying the same fixed amount every week.
A practical accumulation schedule might look like this:
Price Drop from ATH | Weekly DCA Amount | Reasoning
20-40%             | $100             | Early decline, caution
40-60%             | $200             | Clear bear market
60-75%             | $400             | Historical support zones
75%+               | $800             | Maximum fear, best values
Focus on quality. Bear markets destroy marginal projects while the leaders survive. Bitcoin and Ethereum have both weathered multiple bear markets; roughly 90% of the altcoins from previous cycles simply disappeared. Accumulating proven assets reduces the risk of permanent capital loss, not just temporary drawdowns.
Set price alerts instead of watching charts constantly. Mental health matters during extended downturns, and staring at a declining portfolio every hour doesn't help your decision-making. Establish the levels where you'd add, set your alerts, and step away. It prevents emotional decisions and makes the whole experience more bearable.
Identifying Reversal Signals
Real bear market bottoms share recognizable characteristics. Volume dries up as sellers exhaust themselves and buyers stay cautious. Capitulation wicks — those sudden sharp drops followed by equally sharp recoveries — signal forced liquidations clearing out leveraged positions. And media sentiment hits maximum pessimism, with "crypto is dead" headlines appearing everywhere.
Technical indicators tend to align at major bottoms too. Weekly RSI drops below 30, sometimes reaching 20-25. Price touches the 200-week moving average, which has served as strong support in previous cycles. Bitcoin's hash rate stays stable or even grows despite the price collapse, showing that miners still believe in the long-term picture.
On-chain metrics add another layer of confirmation. Exchange outflows suggest accumulation as
Frequently Asked Questions
Should I sell everything when the market keeps dropping?
Selling everything during a downturn locks in your losses and leaves you on the sidelines when the recovery happens. Most beginners who sell in a panic end up buying back in later at higher prices, which is the opposite of what you want. Unless you need the cash urgently, staying invested and waiting out the downturn is usually the smarter move.
What should I do with my money during a bear market?
A bear market is actually a good time to keep buying quality assets at discounted prices, a strategy called dollar-cost averaging. Focus on stable, well-established companies or index funds rather than speculative assets that tend to fall the hardest. Keeping a cash reserve also gives you flexibility to buy more if prices drop further.
How long do bear markets usually last?
Historically, bear markets last an average of 9 to 18 months, which is much shorter than the bull markets that follow them. Knowing this helps you avoid making emotional decisions based on short-term pain. Patience is one of the most effective survival strategies — most investors who hold through a bear market come out ahead over the long run.
Video Resources
Sources & Further Reading
- Investopedia — Reference definitions and explainers for markets and trading.
- Investopedia: Technical Analysis — Indicator-by-indicator guides with worked examples.
- TradingView — Charting platform with community education and indicator scripts.
- CoinGecko — Price history, volume and market capitalisation data.
- BabyPips School — Free structured course on chart reading and risk management.
- Glassnode Academy — On-chain metrics explained, from active addresses to realised cap.
- Wikipedia: Technical analysis — History, methods and the academic debate around technical analysis.